|
BioDiscovery : Research Article
|
|
Corresponding author: Petr Mlejnek (mlejnek_petr@volny.cz)
Academic editor: Nikolai Zhelev
Received: 15 Nov 2016 | Accepted: 24 Jan 2017 | Published: 08 Feb 2017
© 2017 Petr Mlejnek, Petr Dolezel, Eliska Ruzickova
This is an open access article distributed under the terms of the Creative Commons Attribution License (CC BY 4.0), which permits unrestricted use, distribution, and reproduction in any medium, provided the original author and source are credited.
Citation: Mlejnek P, Dolezel P, Ruzickova E (2017) Drug resistance of cancer cells is crucially affected by expression levels of ABC-transporters. BioDiscovery 20: e11211. https://doi.org/10.3897/biodiscovery.20.e11211
|

|
Abstract
Dasatinib (DAS), a second generation of tyrosine kinase inhibitor (TKI), represents excellent choice for the treatment of chronic myeloid leukemia resistant to imatinib. Unfortunately, recent laboratory studies suggested that antiproliferative effect of DAS might be significantly reduced due to the overexpression of the ATP-binding cassette (ABC) transporters, ABCB1 and ABCG2. However, whether these drug transporters might compromise therapeutic effect of DAS in clinic is unclear. We believe that the drug transporter expression level is a crucial factor that affects the results and its consideration may help to explain the existing controversy. In addition, clinically relevant concentrations of drug must be used.
In our study, human leukemia K562 cells with high and low expression levels of ABCB1 or ABCG2 were used. DAS was applied at nanomolar concentrations. We observed that K562 cells expressing high levels of ABCB1 and ABCG2 contained significantly reduced intracellular levels of DAS and these cells exhibited significantly increased resistance to this drug. Importantly, cells with the low expression of ABCB1 or ABCG2 effluxed DAS less efficiently, however, still significantly. Accordingly, the observed resistance was lower but significant. Conclusions: The antiproliferative effects of DAS might be reduced by ABCB1 or ABCG2. However, the actual effect of these ABC transporters on DAS efficiency depends on their expression levels. The lower expression levels of ABC transporters mediate lower resistance. Considering the fact that expression levels of ABCB1 and ABCG2 transporters are usually low in clinical samples, their contribution to the overall resistance to DAS is probably low but significant.
Keywords
Dasatinib, ABCB1, ABCG2, transporter expression level, drug resistance
Introduction
A detailed understanding of the molecular cause of cancer enabled “targeted” treatment: an effective treatment with a minimal damage for healthy cells. Targeted therapy utilises rationally designed drugs that interfere with specific molecules (molecular targets) essential for proliferation and survival of malignant cells. Targeted therapy brought about a revolution in cancer treatment in the last decades (
Tyrosine kinases are especially important target because they play a crucial role in the modulation of number specific signal transduction pathways including cell proliferation and differentiation and therefore if mutated they have the potential to induce oncogenic transformation. Tyrosine kinase inhibitors (TKIs), low molecular weight inhibitors that compete with the ATP binding site of the catalytic domain of oncogenic tyrosine kinases, exhibit effective antitumor activity both in vitro and in vivo. They represent an example of successful targeted therapy (
Despite the promising results of TKIs in clinical trials and clinical practise, recent in vitro studies suggested that their efficiency might be compromised due to the overexpression of the ATP-binding cassette (ABC) transporters, namely ABCB1 (P-glycoprotein, MDR1) and ABCG2 (breast cancer resistance protein, BCRP). However, the possible involvement of ABC transporters in clinical multidrug resistance is difficult to establish. Indeed, the data obtained from in vitro experiments convincingly suggest that particular members of ABC transporter family can mediate multidrug resistance (MDR) in cancer cells. Based on the laboratory findings it was suggested that inhibition of the ABC drug transporter could sensitize drug-resistant tumours. Although this hypothesis is rational, the clinical trials evaluating this strategy mostly have failed to reach a positive endpoint (
Here, we addressed the question how expression levels of ABCB1 and/or ABCG2 affect the cell resistance to DAS. We observed that the expression level of the studied ABC-transporter is an important factor that affects the cell resistance. While cells expressing high levels of drug transporters, which are often used in laboratory experiments, exhibit a high degree of resistance to DAS, cells with low expression levels of drug transporters, which can occur in clinical samples, exhibit much lower but significant degree of resistance to DAS.
Results
Isolation and characterization of cells expressing ABCB1 and ABCG2
In our study, human leukemia cells with high and low expression levels of ABCB1 or ABCG2 were used. Expression levels of the ABCB1 transporter in K562/Dox and K562/DoxDR1 cells are given in Fig.
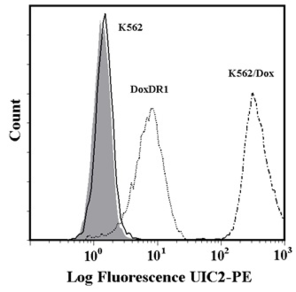
Analysis of ABCB1 and ABCG2 expression.
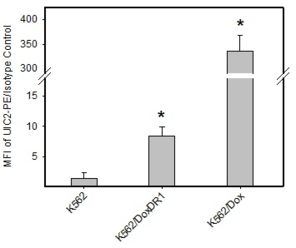
b: Quantitative analysis of ABCB1 expression. ABCB1 expression was quantified as the mean fluorescence intensity (MFI) shift (ratio of MFI of UIC2-PE antibody and isotype control). The experimental points represent mean values from three replicate experiments, with standard deviations. * denotes significant change in ABCB1 expression (P<0.05) between K562 cells and cells expressing various levels of ABCB1 (K562/Dox, K562/DoxDR1).
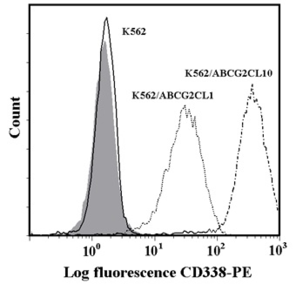
c: Flow cytometric analysis of ABCG2 expression. Isotype control (grey histogram); K562 parental cell line (solid line); K562/ABCG2CL10 cells (dash-dot line); K562/ABCGCL1 cells (dot line).
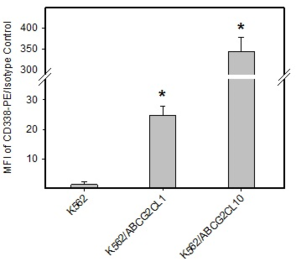
d: Quantitative analysis of ABCG2 expression. ABCG2 expression was quantified as the mean fluorescence intensity (MFI) shift (ratio of MFI of CD338-PE antibody and isotype control). The experimental points represent mean values from three replicate experiments, with standard deviations. * denotes significant change in ABCG2 expression (P<0.05) between K562 cells and cells expressing various levels of ABCG2 (K562/ABCGCL10, K562/ABCGCL1).
The effect of ABCB1 and ABCG2 expression on intracellular levels of dasatinib
The reduction of intracellular drug concentrations which prevents accessibility of drugs to their sites of action is a generally accepted mechanism of resistance mediated by ABC transporters (
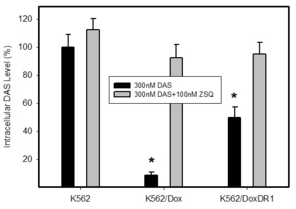
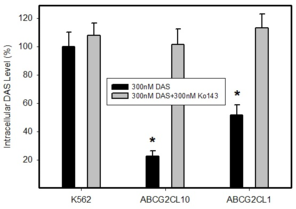
Intracellular levels of DAS in cells expressing ABCB1 or ABCG2. Parental cell line K562, which does not express any of transporter was used as a control. Cells were incubated with 300nM DAS or with 300nM DAS + appropriate inhibitor (100nM ZSQ or 300nM Ko143), as indicated. Intracellular level of DAS was determined after 3h incubation at 37°C. The experimental points represent mean values from three replicate experiments, with standard deviations.
b: A relative intracellular levels of DAS in cells overexpressing ABCG2 transporter. * denotes significant change in intracellular level of DAS (P<0.05) between K562 cells and cells expressing various levels of ABCG2, K562/ABCG2CL10 and K562/ABCG2CL1.
The effect of dasatinib on cell viability and apoptosis induction in cells expressing ABCB1 or ABCG2
Owing to the fact that DAS inhibits cell proliferation and induces apoptosis (
Effect of DAS on cell survival and viability in cells with high and low expression levels of ABCB1 and ABCG2. Cells were treated with DAS for 48h prior to MTT assay.
|
Cell line |
IC50 for DAS |
IC50 for DAS+Inhibitor |
|
K562 |
0,38±0,13 (nM) |
0,43±0,15 (nM) |
|
K562/Dox |
7,66±0,84 (nM) |
0,41±0,21 (nM) |
|
K562/DoxDR1 |
0,82±0,17 (nM) |
0,45±0,14 (nM) |
|
K562/ABCG2CL10 |
5,34±0,71 (nM) |
0,54±0,23 (nM) |
|
K562/ABCG2CL1 |
0,89±0,18 (nM) |
0,52±0,14 (nM) |
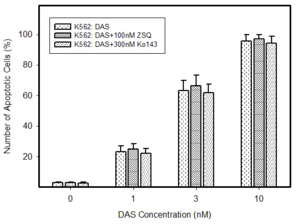
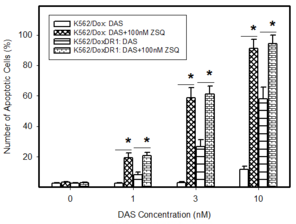
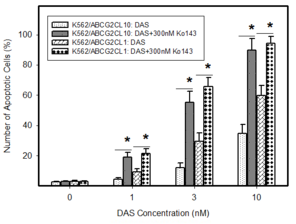
Pro-apoptotic effects of DAS in cells expressing ABCB1 or ABCG2. Cells were treated with DAS or with DAS + appropriate inhibitor, as indicated. After 48h the number of apoptotic cells was determined using fluorescence microscopy. The experimental points represent mean values from three replicate experiments, with standard deviations.
b: Induction of apoptosis by DAS treatment in cells overexpressing ABCB1 transporter. * denotes significant change in the number of apoptotic cells (P<0.05) between resistant K562/Dox and K562/DoxDR1 cells treated with DAS and DAS+ZSQ.
c: Induction of apoptosis by DAS treatment in cells overexpressing ABCG2 transporter. * denotes significant change in the number of apoptotic cells (P<0.05) between resistant ABCG2CL10 and ABCG2CL1 cells treated with DAS and DAS+Ko143.
Discussion
MDR to chemotherapy is a serious obstacle in the treatment of cancer patients. Cancer MDR is defined as the cross-resistance or insensitivity of cancer cells to the cytostatic or cytotoxic actions of various anticancer drugs which are structurally or functionally unrelated and have different molecular targets (
Controversy in results is a common feature of studies evaluating the expression and prognostic role of these proteins and is mostly attributed to methodical factors, largely caused by an insufficient reliability and accuracy of methods used for the assessment of the ABC transporters expression and function (
We believe that contradictory results might be due to oversimplification of evaluation of the MDR phenotype in cancer cells. The approach to this issue must be more complex. Therefore, if we want to evaluate a contribution of a particular ABC transporter to the drug resistance, a clear quantitative relationship among intracellular drug level, particular ABC transporter expression level, and cell sensitivity to this drug must be established. Importantly, the transporter expression level must be relevant to that found in clinical samples (
The later requirement is crucial as the transporter expression level significantly affects the results. The higher transporter expression level effluxes drugs with increased efficiency and thus mediates higher resistance. While some drugs are effluxed effectively even in cells with low transporter expression levels, others are effluxed only poorly or their transport is below detection limits (
Similarly here, observed resistance to DAS depends on ABCB1 and ABCG2 expression levels (Figs
Our results correspond to the finding of other authors who demonstrated that DAS is a substrate of both efflux proteins, ABCB1 and ABCG2 and that these transporters could mediate resistance to this drug (
We think that contradictory results that exist between in vitro experiments and clinics are mostly due to the different expression levels of drug transporters. Indeed, laboratory experiments usually relay on drug selected cell lines or transfected cells with enhanced expression of a studied transporter. Such cells always exhibit huge expression levels of the drug transporter which hardy occur in clinical samples. Data mined from The Cancer Genome Atlas (TCGA) indicates much higher expression levels of ABCB1 and ABCG2 in the normal tissue than in cancer counterpart pairs (
In this work we also address another important issue, namely the concentration of the studied drug in the experimental system used. Recent reports suggested that the interaction between TKIs and ABC transporters is more complex. Indeed, some TKIs, including DAS, may serve as substrates of ABCB1 or ABCG2 at low concentrations, and as their inhibitors at high concentrations (
In conclusion, the antiproliferative and pro-apoptotic effects of DAS might be reduced by ABCB1 or ABCG2 overexpression at clinically relevant concentration. However, the actual effect of the studied ABC transporters on DAS efficiency depends on their expression levels. The lower expression levels of ABC transporters mediate lower resistance. Considering the fact that expression levels of ABCB1 and ABCG2 transporters are hardly high in clinical samples, their contribution to the overall resistance to DAS is probably low but significant.
Materials and methods
Chemicals
Dasatinib monohydrate (DAS, Spyracel, BMS-354825), IUPAC name N-(2-chloro-6-methylphenyl)-2-(6-(4-(2-hydroxyethyl)piperazin-1-yl)-2-methylpyrimidin-4-ylamino)thiazole-5-carboxamide, was obtained from Selleckchem (Munich, Germany). Zosuquidar trihydrochloride (ZSQ; LY335979), IUPAC name (αR)-4-[(1aα,6α,10bα)-1,1-difluoro-1,1a,6,10b-tetrahydrodibenzo[a,e]cyclopropa[c]cyclohepten-6-yl]-α-[(5-quinolinyloxy)methyl]-1-piperazineethanol trihydrochloride, was purchased from Selleckchem (Huston, TX, USA). Ko143 (3S,6S,12aS)-1,2,3,4,6,7,12,12a-Octahydro-9-methoxy-6-(2-methylpropyl)-1,4-dioxopyrazino-[1’,2’:1,6] pyrido [3,4-b]indole-3-propanoic acid 1,1-dimethylethyl ester were obtained from Enzo Life Sciences AG (Lausen, Switzerland).
Cell Culture
Human chronic myelogenous leukemia K562 cells, obtained from ECACC, were cultured in the RPMI-1640 medium supplemented with a 10% calf foetal serum and antibiotics in 5% CO2 atmosphere at 37°C. K562/Dox cells, which overexpress P-gp (ABCB1, MDR1), were kindly provided by Prof J.P. Marie (University of Paris 6, France). K562/Dox cells were cultured under the same conditions. More detailed characterisation of K562/Dox cell line is given elsewhere (
K562/DoxDR1 cells with down-regulated expression of P-gp were established by stable transfection of K562/Dox cells with a plasmid vector expressing shRNA targeting the ABCB1 gene (
K562/ABCG2 cells, which overexpress wild type ABCG2 (BCRP1), were kindly provided by Prof B. Sarkadi (National Blood Center and Semmelweis University, Budapest, Hungary). K562/ABCG2 cells were cultured under the same conditions. Detailed characterisation of K562/ABCG2 cell line is given elsewhere (
Cells expressing different levels of ABCG2 were established by a single cell cloning by limiting dilution of K562/ABCG2 cells (
ABCB1 and ABCG2 expression analysis using flow cytometry
ABCB1 expression was studied by using UIC2 (Beckman Coulter, USA) monoclonal antibody conjugated with phycoerythrin (UIC2-PE) according to the manufacturer’s instruction. Phycoerythrin conjugated isotype IgG2a was used as a control. ABCG2 expression was studied by using mouse anti-human CD 338 (BD Biosciences, USA) monoclonal antibody conjugated with phycoerythrin (CD338-PE) according to the manufacturer’s instruction. Phycoerythrin conjugated isotype IgG2b was used as a control. The fluorescence of the cells was analysed by flow cytometry (Cytomics FC500, Beckman Coulter, USA). ABCB1 expression was determined by the ratio of the mean fluorescence intensity (MFI) shift of UIC2-PE antibody to isotype control (UIC2-PE/IgG2a-PE). Similarly, ABCG2 expression was determined by the ratio of the MFI shift of CD338-PE antibody to isotype control (CD338- PE/IgG2b-PE). For each sample 10 000 events were collected. All the experiments were performed in triplicate.
Determination of cell survival and proliferation
The MTT assay was used for estimation of cell viability and growth as originally described by Mosmann (
Morphological analysis of apoptosis
Cells were fixed and stained with Hoechst 33342 (Fluka), as described previously (
Preparation of cell extracts
The method is based on an optimised extraction of cells with formic acid after their separation from the growth medium by centrifugation through a layer of silicone oil (
Assay for determination of intracellular DAS levels
The HPLC system consisted of UltiMate 3000 RS pump, degasser, autosampler and column compartment (Dionex, Germering, Germany). Separations were performed at ambient temperature on a Polaris C18-A 150 x 2.0mm (i.d.), 5µm particle size column (Varian Inc., Lake Forest, CA, USA) connected with a guard C18 4.0 x 2.0mm (i.d.) precolumn (Phenomenex, Torrance, CA, USA). Solvents used for separation were A (95% methanol in 0.25% FA, v/v) and B (0.5% FA, v/v). The flow rate was 250 μl/min with linear gradient elution from 0 to 3 min (60 to 95% of solvent A), from 3 to 4 min (95% of solvent A), from 4 to 5 min (95 to 60% of solvent A) and from 5 to 8 min (60% of solvent A). Sample injection volume was set at 10 µl. The effluent was introduced into the API 3200 triple quadrupole mass spectrometer (MDS SCIEX, Ontario, Canada) and electrospray ionization in positive ion mode was used for detection. The mass spectrometer was operated in the multiple-reaction monitoring (MRM) mode. DAS was monitored by MRM transition 488 > 401 (dwell-time = 150 miliseconds). Ion spray probe parameters were set to the following values: needle voltage 5500 V, temperature 400ºC, curtain gas (nitrogen) 1.38bar, nebulizer gas (zero air quality) 3.45 bar, turbo V-gas (zero air quality) 3.45 bar. The nitrogen pressure in the second quadrupole was measured at 4.0 x10⁻⁸ bar. The declustering potential, the collision energy and the entrance potential were set at 61 V, 33 V and 7.5 V, respectively. The instrument was operated in unit resolution. Data were collected and processed using Analyst® software (version 1.5.1).
Statistical analysis
Data are reported as the mean ± S.D. Statistical significance of differences was determined by Student’s t-test. Only the P values less than 0.05 were considered significant.
Acknowledgements
This work was supported by grant No: IGA_LF_2016_035 (Internal grant of Palacky University).
Conflicts of interest
Authors declare that they are not in any conflict of interest.
References
-
P-glycoprotein: from genomics to mechanism.Oncogene22(47):7468‑7485. https://doi.org/10.1038/sj.onc.1206948
-
Targeting MDR in breast and lung cancer: Discriminating its potential importance from the failure of drug resistance reversal studies.Drug Resistance Updates15:50‑61. https://doi.org/10.1016/j.drup.2012.02.002
-
Methods to detect P-glycoprotein-associated multidrug resistance in patients' tumors: consensus recommendations.Cancer research56(13):3010‑20.
-
French multicentric evaluation of mdr1 gene expression by RT-PCR in leukemia and solid tumours. Standardization of RT-PCR and preliminary comparisons between RT-PCR and immunohistochemistry in solid tumours.Leukemia11(7):1095‑1106. https://doi.org/10.1038/sj.leu.2400657
-
Comparison of ATP-Binding Cassette Transporter Interactions with the Tyrosine Kinase Inhibitors Imatinib, Nilotinib, and Dasatinib.Drug Metabolism and Disposition38(8):1371‑1380. https://doi.org/10.1124/dmd.109.031302
-
Systemic cancer therapy: Evolution over the last 60 years.Cancer113:1857‑1887. https://doi.org/10.1002/cncr.23651
-
Interaction of the efflux transporters ABCB1 and ABCG2 with imatinib, nilotinib, and dasatinib.Clinical pharmacology and therapeutics95(3):294‑306. https://doi.org/10.1038/clpt.2013.208
-
Multidrug Transporter ABCG2 Prevents Tumor Cell Death Induced by the Epidermal Growth Factor Receptor Inhibitor Iressa (ZD1839, Gefitinib).Cancer Research65(5):1770‑1777. https://doi.org/10.1158/0008-5472.can-04-3303
-
How cancer cells evade chemotherapy: sixteenth Richard and Hinda Rosenthal Foundation Award Lecture.Cancer research53(4):747‑54.
-
Interaction of nilotinib, dasatinib and bosutinib with ABCB1 and ABCG2: implications for altered anti-cancer effects and pharmacological properties.British Journal of Pharmacology158(4):1153‑1164. https://doi.org/10.1111/j.1476-5381.2009.00383.x
-
Dasatinib targets chronic myeloid leukemia-CD34+ progenitors as effectively as it targets mature cells.Haematologica98(6):896‑900. https://doi.org/10.3324/haematol.2012.070268
-
Dasatinib Cellular Uptake and Efflux in Chronic Myeloid Leukemia Cells: Therapeutic Implications.Clinical Cancer Research14(12):3881‑3888. https://doi.org/10.1158/1078-0432.ccr-07-5095
-
Calcein accumulation as a fluorometric functional assay of the multidrug transporter.Biochimica et Biophysica Acta (BBA) - Biomembranes1191(2):384‑388. https://doi.org/10.1016/0005-2736(94)90190-2
-
Important Therapeutic Targets in Chronic Myelogenous Leukemia.Clinical Cancer Research13(4):1089‑1097. https://doi.org/10.1158/1078-0432.ccr-06-2147
-
Can P-glycoprotein mediate resistance to nilotinib in human leukaemia cells?Pharmacological Research67(1):79‑83. https://doi.org/10.1016/j.phrs.2012.10.012
-
Resistance to daunorubicin, imatinib, or nilotinib depends on expression levels of ABCB1 and ABCG2 in human leukemia cells.Chemico-Biological Interactions219:203‑210. https://doi.org/10.1016/j.cbi.2014.06.009
-
Can the assessment ofABCB1gene expression predict its function in vitro?European Journal of Haematology95(2):150‑159. https://doi.org/10.1111/ejh.12470
-
Induction of apoptosis in HL-60 cells by N6-benzyladenosine.Journal of Cellular Biochemistry77(1):6‑17. https://doi.org/10.1002/(sici)1097-4644(20000401)77:13.0.co;2-3
-
P-glycoprotein mediates resistance to A3 adenosine receptor agonist 2-chloro-N6-(3-iodobenzyl)-adenosine-5'-n-methyluronamide in human leukemia cells.Journal of cellular physiology227(2):676‑85. https://doi.org/10.1002/jcp.22775
-
A non-radioactive assay for precise determination of intracellular levels of imatinib and its main metabolite in Bcr-Abl positive cells.Talanta83(5):1466‑1471. https://doi.org/10.1016/j.talanta.2010.11.028
-
Rapid colorimetric assay for cellular growth and survival: application to proliferation and cytotoxicity assays.Journal of immunological methods65:55‑63. https://doi.org/10.1016/0022-1759(83)90303-4
-
Dasatinib (BMS-354825) inhibits Stat5 signaling associated with apoptosis in chronic myelogenous leukemia cells.Molecular Cancer Therapeutics6(4):1400‑1405. https://doi.org/10.1158/1535-7163.mct-06-0446
-
Using CellMiner 1.6 for Systems Pharmacology and Genomic Analysis of the NCI-60.Clinical Cancer Research21(17):3841‑3852. https://doi.org/10.1158/1078-0432.ccr-15-0335
-
Pheophorbide a Is a Specific Probe for ABCG2 Function and Inhibition.Cancer Research64(4):1242‑1246. https://doi.org/10.1158/0008-5472.can-03-3298
-
The controversial role of ABC transporters in clinical oncology.Essays In Biochemistry50:209‑232. https://doi.org/10.1042/bse0500209
-
Zosuquidar restores drug sensitivity in P-glycoprotein expressing acute myeloid leukemia (AML).BMC Cancer8(1): . https://doi.org/10.1186/1471-2407-8-51