Introduction
Autism spectrum disorder (ASD) is an entity that reflects a scientific consensus concerning several previously separated disorders, actually based on current definition a single spectrum disorder with different levels of symptom severity in two core domains - deficits in social communication and interaction, and restricted repetitive behaviors [
Microarray-based gene expression profiling is a useful technology allowing simultaneous measurement of hundreds to thousands of gene transcripts, which is useful for large-scale gene discovery studies [
The above-mentioned findings attracted our interest in identifying novel differentially expressed genes associated with ASD in our population using comparative gene expression profiling based on the next generation sequencing analysis of peripheral blood samples.
Results
Based on the conducted expression analysis we identified 23 differentially expressed genes with statistical significant change (p <0.01, FDR <0.001 and fold change >1), (Table 1).

KEGG pathway enrichment analisys of DEGs
Genes usually interact with each other to play roles in certain biological functions. Pathway-based analysis helps to further understand genes biological functions. We use the Kyoto Encyclopedia of Genes and Genomes (KEGG) pathway database, which is the major public pathway-related database, [

Discussion
The data show differences in gene expression in whole blood of children with autism compared to typically developing children matched for age and gender to the general population. Whole-transcriptome sequencing of pools of all children with autism compared to controls gives comprehensive information on a large number of significantly differentially expressed genes, suggesting that some aspect of "autism" is shared by most of the children sampled. Pathway analyses based on nominally significant genes revealed 21 KEGG pathways, significantly changed in ASD children compared to controls (nominal P-value < 0.05), involved in signaling, immune system and metabolic processes. Our findings suggest that synaptic plasticity, disturbances in axon guidance, neuronal survival, differentiation and inflammation have great role in the pathophysiology of ASD. We briefly discuss some of the most significant pathways below.
Calcium signaling pathway
Dysregulation of calcium signaling pathway is interesting since recent collaborative effort of meta-analysis of five major neuropsychiatric disorders including ASD suggests that two calcium channel coding genes – CACNA1C and CACNB2 – are significantly associated with all five diseases [
Calcium signals culminate by initiating the fusion of synaptic vesicles into the neuronal presynaptic membrane, and the sum of the evidence is that pre- and postsynaptic membrane changes recognized in several fundamental processes of synaptic plasticity and learning are calcium sensitive and are altered in models of ASD. Recent findings in the etiopatogenesis of the ASD-causing Angelman, Prader-Willi, Rett, tuberous sclerosis suggest an inability of neurons to generate adaptive responses via calcium-regulated gene expression [
MAPK signaling pathway
Dysregulation in Ras/mitogen-activated protein kinase (Ras/MAPK) pathway genes lead to a class of disorders known as RASopathies which includes neurofibromatosis type 1 (NF1), Costello syndrome (CS), Noonan syndrome (NS), and cardio-facio-cutaneous syndrome (CFC). Potential genetic and phenotypic overlap between dysregulation of Ras/MAPK signalling and ASD were suggested in previous studies. Higher prevalence and severity of ASD traits in RASopathies compared to unaffected siblings propose that dysregulation of Ras/MAPK signalling during development may be implicated in ASD risk [
Wnt signaling pathway
The Wnt pathway is involved in various well-known cellular processes including differentiation and migration, especially during nervous system development and cell proliferation. Given its various functions, dysfunction of the canonical Wnt pathway probably exert adverse effects on neurodevelopment and therefore leads to the pathogenesis of autism.
In the last years an increased amount of evidence has shown that components of Wnt pathways are involved in major psychiatric disorders. A literature review supports the contention that modification of genes affecting the activity of the Wnt pathway could contribute to individual forms of ASD [
Glutamatergic and GABAergic synapse
Critical balance between excitatory glutamate and inhibitory GABA neurotransmitter is essential and crucial for proper development and functioning of brain. GABAergic (gamma aminobutyric acid) and glutamatergic interneurons maintain excitability, integrity and synaptic plasticity. Several recent evidences implicated relative loss of inhibitory GABA with corresponding glutamate mediated hyper-excitation in development of ASD. Moreover, several studies have demonstrated the imbalance of excitatory/inhibitory neurotransmitters resulting from neurodevelopmental impairments in glutamatergic and GABAergic system, which might resemble a common pathological mechanism underlying developmental disorders. [
In summary, our list of differentially regulated genes is enriched with pathways associated with nervous system development and function, and immune system and most of them seem to be around core networks such as those involved in kinase and/or signaling networks. Therefore, our results support the involvement of various genetic factors (heterogeneity) in the development of ASD, while suggesting these different factors can be converging at, or diverging from central networks such as signaling networks.
Findings from our current study demonstrate that there are clear and significant abnormalities in the gene expression of peripheral blood samples obtained from children with ASD compared to healthy controls. This promising work, while far from being definitive, gives further proof to the recently emerging principle that peripheral blood is a potentially useful source of diagnostic biomarkers for disorders of the brain and other inaccessible tissues [
Materials and methods
Subjects
A total of 30 subjects (24 - male; 6 - female) with idiopathic ASD aged 3 to 11 years (mean age of the sample - 6.86 years), and 30 healthy children age and sex matched to the patient’s group were recruited for gene expression analysis Participants were interviewed by experienced child psychiatrists. The diagnose ASD was established by the use of ADI-R [
Written informed consent and child assent were obtained from the parents and the probands, respectively, after the purposes and procedures of the study were fully explained and confidentiality was ensured.
Laboratory methods
Blood collection and RNA isolation
An aliquot of peripheral whole blood samples (2.5 ml) for each subject (ASD diagnosed and healthy controls) was collected into PAXgene blood RNA tubes (PreAnalytiX) and stored for minimum of 4 hours and then freezed at −80°C, as this method shows the biggest yield of RNA [
Quantitative analysis of the isolated total RNA samples
The measured absorbance ratio of 260 nm and 280 nm (A260/A280) was between 1.93 and 2.1 for all samples included for further analysis, according to the service requirements. Pooled samples were created by adding an equivalent amount of total RNA from each individual sample to final concentration of 5 µg RNA samples. Pooled RNA samples were precipitated according to the service requirements, each pooled RNA sample was mixed with 1/10th volume of 3M NaOAc, pH 5.2 and 3 volume 100% ethanol, tо the final volume of 400 µl. Aliquots of pooled RNAs were frozen at -80°C and shiped on dry ice. RNA integrity of pooled samples (ASD and control group) was assessed by agarose gel electrophoresis (Fig. 1) and checked by Agilent 2100 Bioanalyzer (Fig. 2 and 3).
 and healthy controls (HC), respectively.")
.The two tall peaks at 2000 and 4000 are the ribosomal RNA. RNA integrity number (RIN) of the pooled total RNA were calculated from the bioanalyzer traces. Pooled total RNA has RNA integrity number (RIN) 7.7.")
. The two tall peaks at 2000 and 4000 are the ribosomal RNA, RNA integrity number (RIN) of the pooled total RNA were calculated from the bioanalyzer traces. Pooled total RNA has RNA integrity number (RIN) 7.9.")
RNA-Seq (quantification) analysis
In this study we used Beijing Genomics Institute (BGI) as a Certified Service Provider for sequencing service. The total RNA samples were first treated with DNase I to degrade any possible DNA contamination. Then the mRNA was enriched by using the oligo(dT) magnetic beads. Mixed with the fragmentation buffer, the mRNA was fragmented into short fragments (about 200 bp). Then the first strand of cDNA was synthesized by using random hexamer-primer. Buffer, dNTPs, RNase H and DNA polymerase I were added to synthesize the second strand. The double strand cDNA was purified with magnetic beads. End reparation and 3’-end single nucleotide A (adenine) addition was then performed. Finally, sequencing adaptors were ligated to the fragments. The fragments were enriched by PCR amplification. During the QC step, Agilent 2100 Bioanaylzer (Fig. 1 and 2). and ABI StepOnePlus Real-Time PCR System were used to qualify and quantify of the sample library. The library products were sequencing via Illumina HiSeqTM 2000.
Quantification of gene expression
The expression level for each gene was determined by the numbers of reads uniquely mapped to the specific gene and the total number of uniquely mapped reads in the sample. The gene expression level was calculated by using RPKM. [
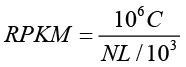
RPKM is a method of quantifying gene expression from RNA sequencing data by normalizing for total read length and the number of sequencing reads. The RPKM method is able to eliminate the influence of different gene length and sequencing discrepancy on the calculation of gene expression level. Therefore, the RPKM values can be directly used for comparing the difference of gene expression among samples. If there is more than one transcript for a gene, the longest one is used to calculate its expression level and coverage.
Screening of differentially expressed genes (DEGs)
This analysis includes the screening of genes that are differentially expressed among samples and KEGG pathway enrichment analysis for these DEGs. Referring to "The significance of digital gene expression profiles" [
Denote the number of unambiguous clean tags from gene A as x, given every gene’s expression occupies only a small part of the library, p(x) will closely follow the Poisson distribution.
(λ is the real transcripts of the gene)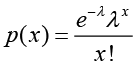
The total clean tag number of the sample 1 is N1, and total clean tag number of sample 2 is N2; gene A holds x tags in sample 1 and y tags in sample 2. The probability of gene A expressed equally between two samples can be calculated with:
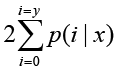
or 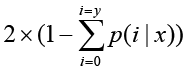
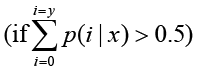
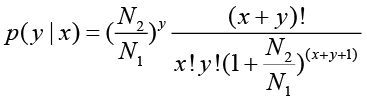
P-value corresponds to differential gene expression test. FDR (False Discovery Rate) is a method to determine the threshold of P-value in multiple tests and assume that we have picked out R differentially expressed genes in which S genes really show differential expression and the other V genes are false positive. If we decide that the error ratio "Q = V / R" must stay below a cutoff (e.g. 1%), we should preset the FDR to a number no larger than 0.01 [
References
- A.P. Association, The Diagnostic and Statistical Manual of Mental Disorders: DSM 5, 2013.
- Baio J. Prevalence of Autism Spectrum Disorders - Autism and Developmental Disabilities Monitoring Network, 14 Sites, United States, 2008 Surveillance Summaries March 30, 2012 / 61(SS03);1-19.
- Eapen V: Genetic basis of autism: is there a way forward? Curr Opin Psychiatry 2011; 24(3): 226-236.
Reference Link - State MW, Levitt P: The conundrums of understanding genetic risks for autism spectrum disorders. Nat Neurosci 2011; 14(12): 1499-1506.
Reference Link - Schena M, Shalon D, Heller R, Chai A, Brown PO, Davis RW. Parallel human genome analysis: microarray-based expression monitoring of 1000 genes. Proc Natl Acad Sci USA 1996, 93(20): 10614-10619.
Reference Link - Konradi C: Gene expression microarray studies in polygenic psychiatric disorders: applications and data analysis. Brain Res Brain Res Rev 2005; 50(1): 142–155.
Reference Link - Woelk CH, Singhania A, Pérez-Santiago J, Glatt SJ, Tsuang MT. The utility of gene expression in blood cells for diagnosing neuropsychiatric disorders. Int Rev Neurobiol 2011; 101: 41–63.
Reference Link - Sullivan PF, Fan C, Perou CM. Evaluating the comparability of gene expression in blood and brain. Am J Med Genet B Neuropsychiatr Genet 2006; 141B(3): 261–268.
Reference Link - Kanehisa, M., Araki M, Goto S, Hattori M, Hirakawa M, Itoh M et al. KEGG for linking genomes to life and the environment. Nucleic Acids Res 2008; 36 (Database issue): D480-4.
- Cross-Disorder Group of the Psychiatric Genomics, Consorcium. Identification of risk loci with shared effects on five major psychiatric disorders: a genome-wide analysis. Lancet 2013; 381(9875): 1371-1379.
Reference Link - J. Jay Gargus, Galina Schmunk Dysregulation of Neurogenic Calcium Signaling and Autism in Comprehensive Guide to Autism, Springer New York 2014, pp 1285-1312.
- Adviento B, Corbin IL, Widjaja F, Desachy G, Enrique N, Rosser T, et al. Autism traits in the RASopathies. J Med Genet. 2014; 51(1): 10-20.
Reference Link - Zhang Y, Yuan X, Wang Z, Li R: The Canonical Wnt Signaling Pathway in Autism. CNS Neurol Disord Drug Targets 2014; 13(5): 765-770.
Reference Link - Purkayastha P, Malapati A, Yogeeswari P, Sriram DA. Review on GABA/Glutamate Pathway for Therapeutic Intervention of ASD and ADHD. Curr Med Chem 2015 Feb 9[Epub ahead of print]
Reference Link - Kohane IS, Valtchinov VI. Quantifying the white blood cell transcriptome as an accessible window to the multiorga n transcriptome. Bioinformatics. 2012; 28(4): 538-545.
Reference Link - Lord C, Rutter M, Couteur AL. Autism Diagnostic Interview–Revised: A Revised Version of the Diagnostic Interview for Caregivers of Individuals with Possible Pervasive Developmental Disorders. J Autism Dev Disord 1994; 24(5): 659-685.
Reference Link - Gilliam, J. Gilliam Autism Rating Scale Examiner's Manual. Austin, 1995; TX: Pro-Ed.
- T. Vachev, I Minkov, V Stoyanova, N Popov. Down regulation of miRNA let-7b-3p and let-7d-3p in the peripheral blood of children with autism spectrum disorder. Int.J.Curr.Microbiol.App.Sci 2013; 2(12): 384-388.
- Mortazavi A, Williams BA, McCue K, Schaeffer L, Wold B. Mapping and quantifying mammalian transcriptomes by RNA-Seq. Nature Methods 2008; 5(7): 621-628.
Reference Link - Audic S, Claverie JM. The significance of digital gene expression profiles. Genome Res 1997; 7(10): 986-995.
- Benjamini Y, Yekutieli D. The control of the false discovery rate in multiple testing under dependency. Ann Stat. 2001; 29(4): 1165-1188.